
Micro-optimization: How to Optimize Your Campaigns Faster and More Effectively
So what is micro-optimizing?
Get ready for some good old fashioned digital marketing nerdsplaining!
Micro-optimizing is using small but statistically significant tests based on micro-conversions to determine what is working best in your campaigns.
It empowers you with the data that you need to optimize your campaigns for better results much faster and more effectively.
What is a micro-conversion?
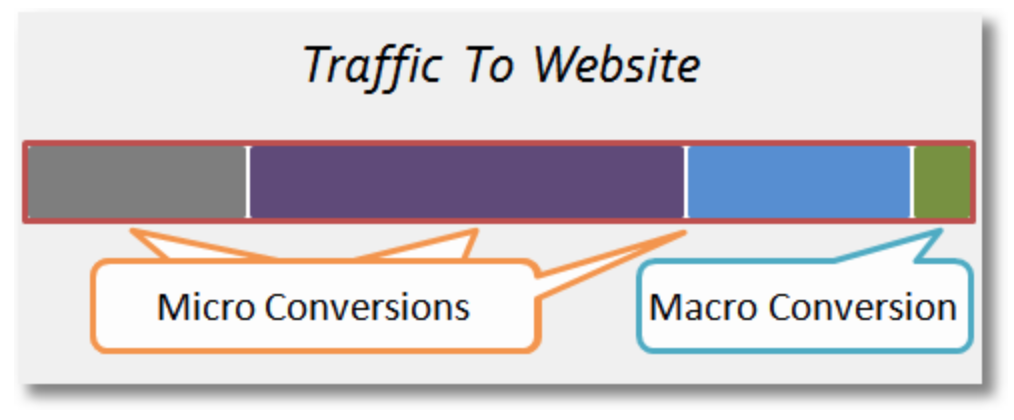
A micro-conversion is built on Avinash Kaushik’s idea of ‘micro’ and ‘macro’ conversions.
Simply put, a ‘macro’ conversion is going to be whatever is bringing in revenue for your business. Be that software subscriptions, dog training treat sales, or a new client for your agency.
A ‘micro’ conversion is going to be anything that leads up to that macro conversion. I.e someone spending 5 minutes on your site reading your marketing materials. Or someone putting a product in your shopping cart before buying to see what the total cost with tax and shipping would be (tip you should be retargeting these people with abandoned cart ads).
Why do we need it?
Many times, a businesses web analytics measurement model looks something like this:

Image borrowed from Avinash’s blog post - full credit to Avinash.
Most websites are going to a macro-conversion rate around 2%. If you only look at your main conversion that means you are essentially ignoring the 98% of website visitors that did not purchase from you on their visit.
Your measurement should look more like this:
It’s plain to see that filling the measurement model with insightful data is going to give you much more information to use in optimizing your campaign and your businesses performance.
In addition to helping you better understand your website audience, micro-optimizing can be used to optimize your paid marketing campaigns to determine the best:
Audience
Ad copy
Keyword
Bid strategy
Landing page
And more....
How can I start ‘micro-optimizing’ my campaigns?
The first step is going to be setting up your measurement model to include micro-conversions. You need to do this in your analytics platform (which is going to be Google Analytics for the vast majority of businesses). Facebook is going to be a little different and we’ll get into that below.
There are many different types of micro-conversions but ultimately the ones you choose should do these 2 things:
Align with real business goals and objectives
Correlate to these business goals and objectives. I.e you should know if someone spends 10 minutes on your site that they are more likely to buy than someone who spends 2 seconds. Or someone who requests a free audit is likely to become a client.
For a small digital marketing and design shop like ours, we would want to data like:
“Users that spend at least 2 minutes on our site” or “Users that viewed at least 2 pages on our site”. These certainly align with our business goals and correlate with potential client behavior.
For a SaaS company that sells to Marketing VP’s at Fortune 500 companies, maybe their micro-conversion is a PDF download, or a request for product demonstration by a salesperson with a cleverly disguised non-salesy sounding title.
AdWords example:
The best way to do this for AdWords campaigns is to set up some sort of goal in Google Analytics and then import it into AdWords. This will give you the data you want down to the campaign, ad group, keyword, ad level.
This is as granular as you can get, but you’ll need to make sure that your AdWords and GA accounts are linked first.
Create the goal in Google Analytics. Kissmetrics gives a good walkthrough here.
Import the goal(s) into your Google AdWords account.
Start optimizing!
Facebook Ads:
Facebook does not play well with Google Analytics at all. There is not a direct integration like there is from AdWords to Google Analytics.
Even when you set up Google Analytics tracking URLS (UTM codes) you will probably only see a fraction of clicks from Facebook actually translate into trackable sessions in Google Analytics.
To ‘micro-optimize’ in Facebook, you will want to set up the relatively new Facebook pixel on all pages of your website or mobile app and then setup event tracking and/or custom conversion tracking.
Your custom conversion or event would align with one of these micro-conversions. I.e if someone downloads one of your PDF’s - track that as an ‘lead’.
How to start micro-optimizing:
Now that you have your micro-conversions setup, and you have campaigns up and running let’s look at an example of how you would micro-optimize.
AdWords Ad Optimization
In AdWords you can ‘segment’ your conversions to see all of the different conversion types that you are tracking and the results tied to your campaign. Note that these are not reported on retroactively so you will only be able to see this data after you complete the steps above.
Here is an example of optimizing ad performance in AdWords using a micro-conversion setup to track users that spend at least 2 minutes on a website.
Ad Testing: Ad “A” Vs Ad “B”
Which ad performs better?
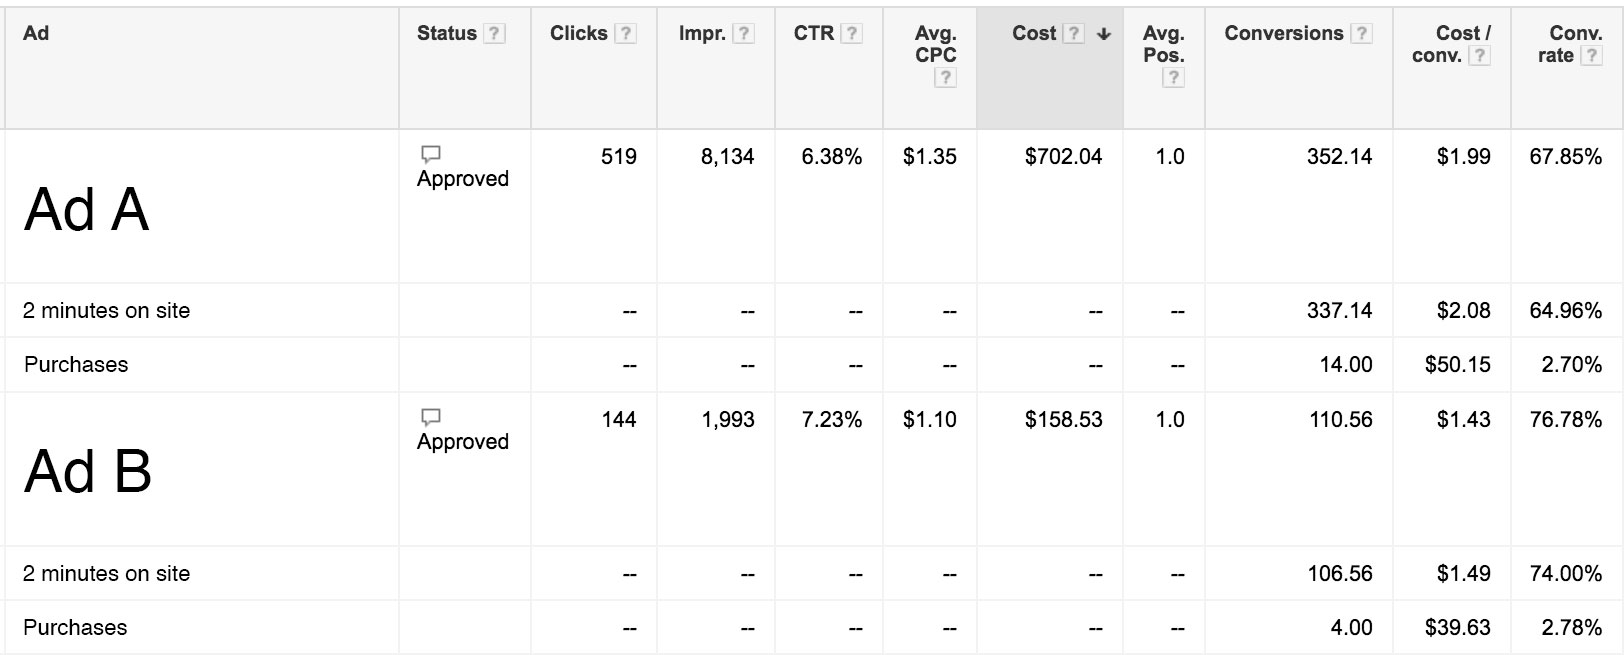
Not using micro-conversion:
Looking at actual purchases of the product there is not enough data to have a statistically significant result. We can either continue to spend budget and wait until there is enough data, or look at another conversion metric with more volume.

Using micro-conversion:
Looking at users who spent at least 2 minutes on the website we see that ad “B” is the statistically significant winner of this ad test with a higher conversion rate (73.61% vs 64.93%)

Ad B performs better than ad A by 13% with 98% certainty.
Optimization action - pause ad A and create a new ad based on ad ‘B’. Run another test, rinse and repeat!
Facebook Optimization
In Facebook you will need to customize your reporting columns to pull your micro-conversions into your report. For this test we compared the performance of 2 different retargeting audiences.
Audience Testing: Retargeting audience 1 vs. retarget audience 2
Which retargeting audience performs better?

Not using micro-conversion:
Looking at actual ‘purchases’ of the product.

Not enough data again. Either continue to spend budget until there is a winner, or look at micro-conversion data.
Micro-conversion data - statistically significant results:
Looking at views of the shopping cart page instead of actual purchases.

Audience B converts 61% better than A. Optimzation action - move budget from A to B or shutdown A entirely. Start a new test, rinse and repeat.
As you can see, doing this will get to to statistical relevance faster, without having to spend as much budget. Ultimately this is going to drive much better performance from your digital campaigns and you will need to spend less to get better results. I don’t know what marketer or business owner wouldn’t want that!
Thanks for reading!
If you need help or have questions about how to set any of this up contact us here feel free to shoot me an email at andrew@levelup-digital.com